With the first of the glorious summer sun starting to shine down on us, we started to ponder about what environmental impact they'd had over the last 5 months.
Luckily for us, our solar panels have an API, so we can not only find out that information, we can request it from SolarEdge and display it in our very own interface.
If I lost you at API, it isn't a type of hipster beer. API stands for application programming interface. A company can make some of its data available to developers by building an API, a set of dedicated URLs that return data responses . This article describes them as little robo-waiters, serving up data to other apps and websites.
I'm always up for a fun side project, so when I saw that Earth day was on the horizon, I grabbed the opportunity. I make a lot of cute web animations and interactive code experiments on CodePen. But I've never tried to visualize any data before. So the first step was to find out what was accessible. What data could I get my hands on?
Jeremy and I got up the docs and started doing some investigation. The first thing that jumped out at us was this -
*treesPlanted: equivalent planting of new trees for reducing CO₂ levels*
Wouldn't it be cool if over the years we could somehow see the number of trees we'd "planted"? Create a kind of digital forest and watch it grow?
I started scribbling down some rough ideas. I wanted the visual to link to Clearleft and Brighton somehow but there aren't many forests (or gardens) in central Brighton. A roof garden seemed like a good location for our digital forest.
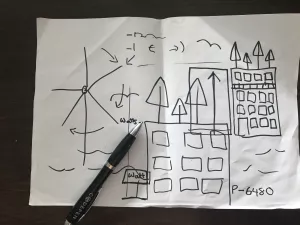
68 middle street has a lot of windows, so that jumped out as a good way to display our current power.
Our peak power is 6.48 kWp and is essentially the rate at which our solar system generates energy at noon of a super sunny day. The amount of energy a system generates is measured in kilowatt hours (kWh). Each of our kWp's should generate around 800 to 850 kWh per year (if we get a decent amount of sunshine, which in the UK is sometimes rather elusive) By querying our peak power and current power, we can work out what percentage of our overall capacity we're currently at.
Once I'd worked out what data I wanted, I used the fetch API to get it. This tutorial by Sara Vieira helped me to wrap my head around this.
fetch() allows us to make network requests similar to XMLHttpRequest. The main difference is that the Fetch API uses Promises. A promise object is data returned by asynchronous function. It will resolve if the function returned successfully or reject if the function returned an error.
        fetch("https://our-API-URL")
 .then(response => response.json())
 .then(response => {
   // Do all the fun stuff with the data here!
 })
 .catch(err => {
   console.log("oh no. something went wrong");
 });
First we call the fetch API and pass it the URL we want to get the data from, as we haven't specified any other parameters, this will be a simple GET request. We also want our data as a JSON object so we add response.json to parse the response as JSON.
If the promise gets resolved, our then function will trigger and do all the fun stuff with the SVG illustration and the API data. And if our promise gets rejected our catch function will trigger and throw an error to alert us.
As for the illustration itself! The illustration is an SVG, or scalable vector graphic. The best bit about SVG that it gives you is the ability to manipulate it's properties.
SVG has a DOM, much like HTML and when used inline, (by putting the SVG code right into your HTML), you can access this DOM with CSS or Javascript and do things to it.
        <svg class="68middlestreet"... >
   <path class="sky" fill="#91b1bf" d="M9 52.1h813.2v767.6H9z" />
    <g class="clouds">
      <path fill="#d9eafc" d="M-207.6 395.2c14.2..."/>
      <path fill="#f9f9f9" d="M-67.2 389.9s-5.4 3-..."/>
    </g>
     ...
</svg>
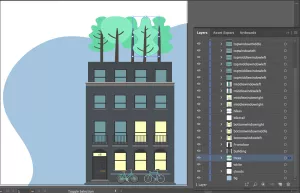
I created the SVG building in illustrator. It was a pretty large SVG with a lot of detail, and the exported code can be pretty unwieldy straight out of a graphics editor. So I ran it through SVGOMG to tidy it up.
When the then function gets triggered, I'm adding a class called animate to the body of the HTML. I'm using CSS for the animations, and I've bound the animations to this class.
This ensures that the animations don't start before the data response has come back from the API, as we require that information to know how many trees to grow and windows to light up.
        .then(response => {
 document.body.classList.add("animate");
 ...
})
        .animate .tree {
  animation: grow 0.6s cubic-bezier(0.175, 0.885, 0.32, 1.1) forwards 1s;
}

@keyframes grow {
  from {
    opacity: 0;
    transform: scale(0) translateY(100%);
  }
  to {
    transform: scale(1) translateY(0);
    opacity: 1;
  }
}
My personal favourite bit of this project was creating an accurate representation of the number of trees.
If there's a fractional part to the number of trees. i.e. 2.3 instead of 2, we get to create a cute mini-tree!
I used a modulo operation to find the remainder after dividing by one and then set the tree size to that remainder.
        var littleTreeSize;
var isLittleTree = false;

// work out if there's a small tree
var treeMod = treeCount % 1;
// if there's a remainder then set isLittleTree to true
var isLittleTree = treeMod > 0;

if (isLittleTree) {
 // set little tree size
 littleTreeSize = treeMod;
}
All in all this was great fun. I look forward to a summer full of sunshine so that we can watch a digital forest spring up from our rooftop!