Whether creating products or services, working for an agency or for an in-house team, the list of potential features and ongoing fixes is always outpaced by the available time to explore, build and release them.
In ‘Good Strategy. Bad Strategy’ Richard Rumelt says sagely: “strategy is at least as much about what an organisation does not do as it is about what it does”.
With this in mind, here’s a roundup of some simple techniques for prioritisation. These can help project teams take control and manage their backlog. After all, your time is too valuable to make decisions on what to work on next by deferring to the hippo (highest paid person’s opinion) in the room or by the toss of a coin.
Plotting value versus effort
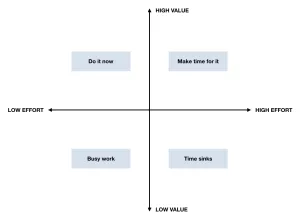
Let’s start with a deceptively simple but incredibly robust method: the 2x2 matrix. In this example user value is plotted against production effort. However, any two competing dimensions can be used.
It’s an ideal technique to use when you have lots of data points. Seeing the spatial relationship between them will help you identify where the quick wins and long-term value can be found.
We often use this technique with clients to collectively decide which recommendations we will prioritise from an expert review or findings from user research and which suggestions fall into the quadrants of busy work or time sinks.
The matrix can be created in a lo-fi way. All you need is brown paper, masking tape, and each item written on an individual post-it® notes to make the information easy to plot and re-plot. Equally, you can use a collaborative digital tool such as Miro. This is ideal if the team doing the prioritisation is geographically distributed.
In either case, prepare the information to plot in advance so you can use the time in the workshop to map what goes where. People often fall into the trap of trying to make everything high value. To counter this force a decision on relative priorities by insisting that the sticky notes cannot overlap one another.
Voting for precedence

Use this technique when you need to decide what to prioritise from a competing shortlist of possible options.
In essence, you systematically compare each idea against every other one until you end up with a ranked and scored list of priorities.
I was introduced to this prioritisation technique by John Sunart who credits Norman McNally for introducing him to it.
Although the activity takes time, it is worth it if you need to evaluate the relative merit of ideas from a set of options. Give yourself at least 40 minutes for half a dozen deciders to work through a set of six options. Increase the time by five minutes for every additional option, and don’t go over 10 competing options without energy gels at hand.
The process is relatively straightforward:
- Get to around six competing choices. You could dot vote to shortlist.
- Draw up a grid. Write in the ideas being evaluated on both the x and y axis. Blank out ideas competing against themselves.
- Call out two competing features and ask your participants for a show of hands if they think the first feature is more important, relevant or doable than the second.
- Count the hands and add the score to the chart (in two places) for the first and second feature under consideration.
- Move across the rows from left to right until all the boxes have numbers in.
- Add up the numbers in each row and rank the ideas from the scores.
This activity works best when the focus is on voting rather than discussing each option. To help keep the activity on track, circulate a brief description of the ideas for consideration to participants in advance of running the workshop.
Checking there’s innovation in your mix

Another matrix, this one is ideal to sense-check the makeup of your product roadmap. It will quickly show if you are over-indexed on business as usual and if the team has time set aside for exploring potential futures.
The How? Now, Wow! matrix is included in Gamestorming, a perennial favourite on the Clearleft bookshelf for finding practical workshop activities.
Ideally, you are looking for a blended programme of work with items in each of the three named quadrants. It’s a useful method to periodically revisit to evaluate if your team is spending its time appropriately looking across the different horizons of the now, the next and the future.
Placing your bets and backing the favourites

I serendipitously came across this a few years ago via a retweet from a friend. The doodle from Hias Wrba (@ScreaminHias) perfectly encapsulates that not all decisions are (or should be) treated equally.
Some product decisions are low cost and low risk. Getting on with building them offers more value than having another meeting to debate them. Other options with a higher level of uncertainty and/or risk can best be answered by doing research to provide more insights to give confidence in your future decision making.
I’m a big fan of having the value and cost scales plotted in humanly understandable terms (going from a beer, a holiday, a month’s salary, a car, a house). Because of these scales, I find this a great tool to use when you want a team to start thinking about their work in terms of competing decisions with financial implications. This matrix also works a treat in workshops to move people from circular conversations to quickly deciding the next best steps for the ideas being evaluated.
Counting on a repeatable formula

We’ve used this formula and variations of it on numerous projects. Most recently we introduced it to a client’s customer experience team. They managed multiple websites and wanted a framework that could be used to evaluate requests from numerous stakeholders. They found having a score, from a robust formula, replaced emotive reasoning with a more rational approach to their prioritisation process.
The technique came to my attention via an article written by Jared Spool who in turn credits the method to Bruce McCarthy.
The toughest part of using this method is to define your terms so everyone is clear on what you mean by value, effort and confidence.
For example, value could purely be user value, or business value, or a blend of the two. You might be more focussed on increasing brand reputation rather than revenue or improving the usability of your product over retention rates.
Likewise, you might articulate and estimate effort in terms of person-hours, the combined capital and operational expenditure, or the blood, sweat and tears the team will shed.
Confidence is a subjective measure. It can come from having robust user research or having already done a technical proof of concept, or for less risky and innovative suggestions, from best practices or trivial technical requirements.
The important thing is that everyone has a shared understanding of the terms being used.
Once you’ve agreed your terms it’s then time to review the scoring system. We tend to keep things simple. Value and effort have a shared three-point scale (1=low, 2=medium, 3=high). For confidence, we use a numeric value between 0 (for no confidence) and 1 (absolutely sure) with incremental steps of 0.25 giving an increased level of certainty.
Now you’re ready to add the numbers and formula into a spreadsheet with an additional column at the front for features for consideration.
We find the use of a visible, shared spreadsheet particularly useful when dealing with multiple stakeholders. It enables prioritisation to easily be done over many sessions and for the list to be seen as a living document.
Making prioritisation a priority
Prioritisation isn’t and shouldn’t be a one-off exercise. The changing needs of your customers, the business environment and new opportunities from technology mean prioritisation is best done as a regular activity.
There isn’t a single right way to prioritise your work. Different methods help in different situations. Try out some of these methods to see which best helps you. The important thing is that your teams know what they are going to tackle next and why.

